一、下载及使用
1.1 手机设置
[附件: enable_gpu_info.sh]
chmod a+x enable_gpu_info.sh
./enable_gpu_info.sh
1.2 trace抓取
抓perfetto:修改配置文件
- 想具备kgsl events相关信息,添加下面划线部分
data_sources {
  config {
    name: "linux.ftrace"
    ftrace_config {
      ftrace_events: "kgsl/kgsl_pwrlevel"
      ftrace_events: "kgsl/gpu_frequency"
      ftrace_events: "kgsl/kgsl_gpubusy"
      ftrace_events: "kgsl/kgsl_pwrstats"
      ftrace_events: "kgsl/adreno_cmdbatch_queued"
      ftrace_events: "kgsl/adreno_cmdbatch_ready"
      ftrace_events: "kgsl/adreno_cmdbatch_sync"
      ftrace_events: "kgsl/adreno_cmdbatch_submitted"
      ftrace_events: "kgsl/adreno_cmdbatch_retired"
      ftrace_events: "kgsl/adreno_cmdbatch_done"
      buffer_sizee_kb: 8192
      drain_period_ms: 250
      compact_sched {
        enabled: true
      }
    }
  }
}- 想具备gpu.renderstages相关信息,添加
data_sources {
  config {
    name: "gpu.renderstages"
    gpu_counter_config {
      counter_period_ns : 250000000
    }
  }
}- 想具备gpu.counters相关信息,按需添加/启用
data_sources {
  config {
    name: "gpu.counters"
    gpu_counter_config {
      counter_period_ns: 100000000
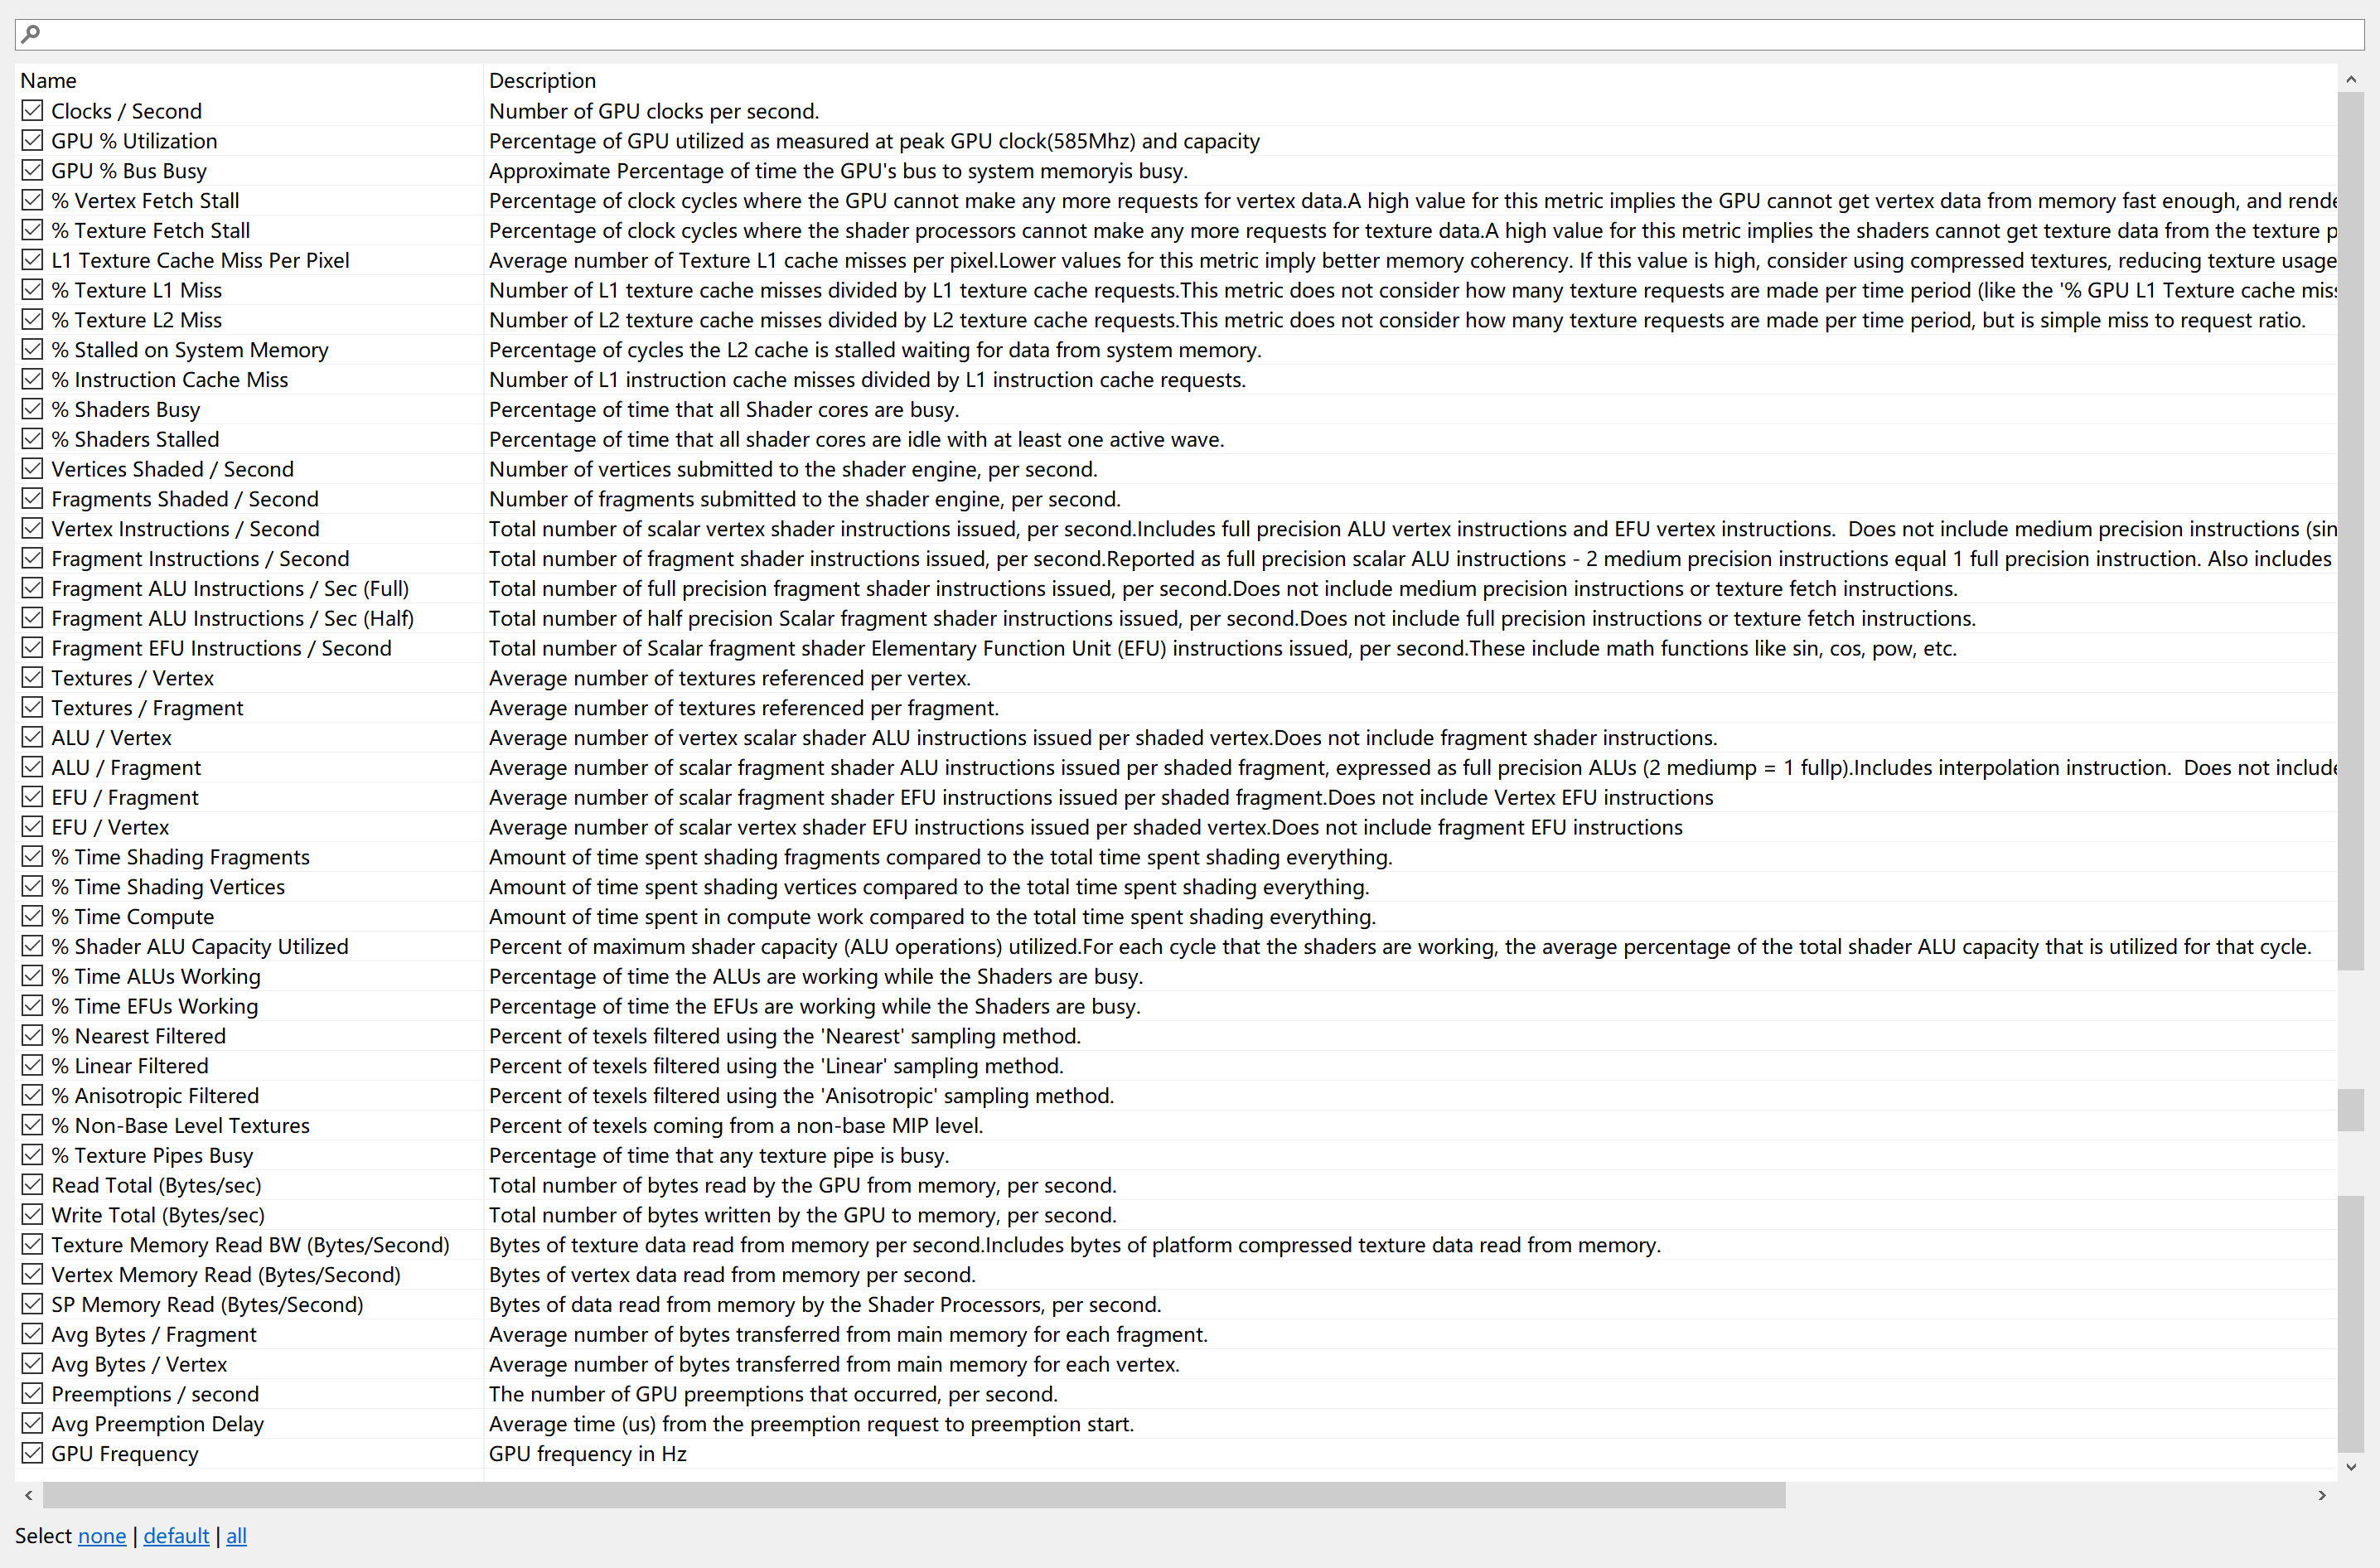
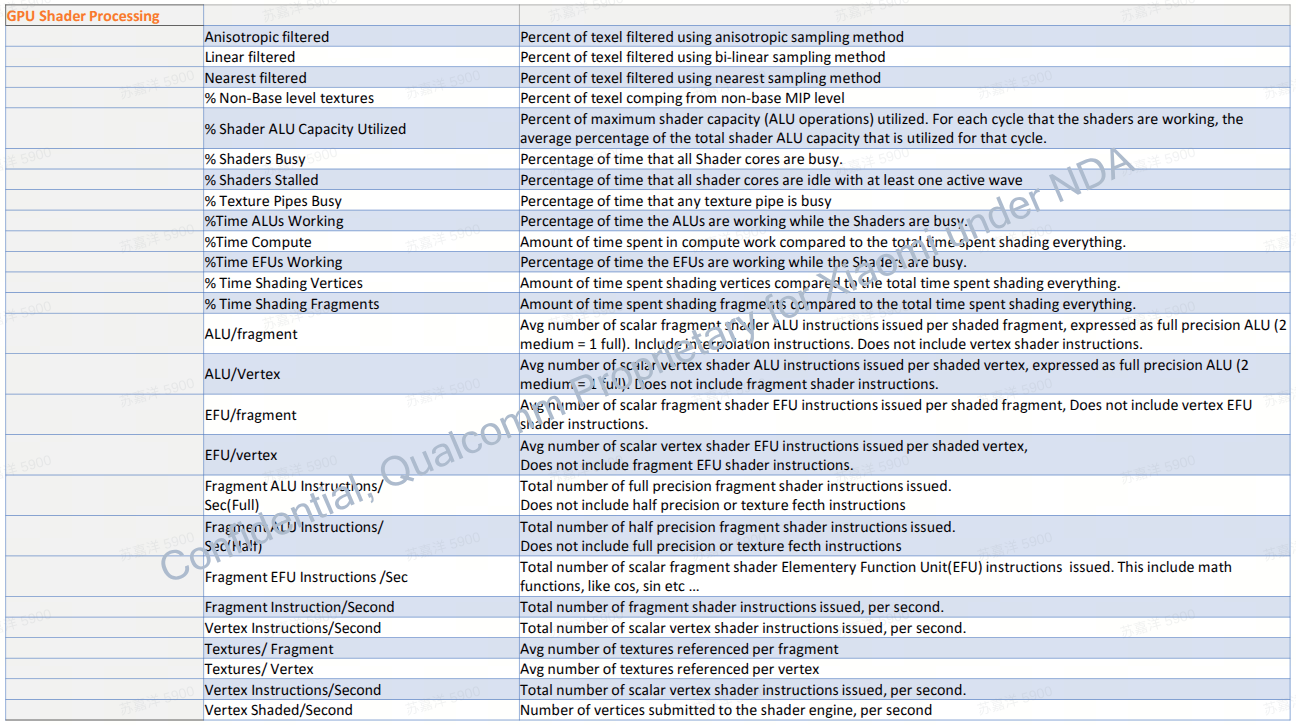
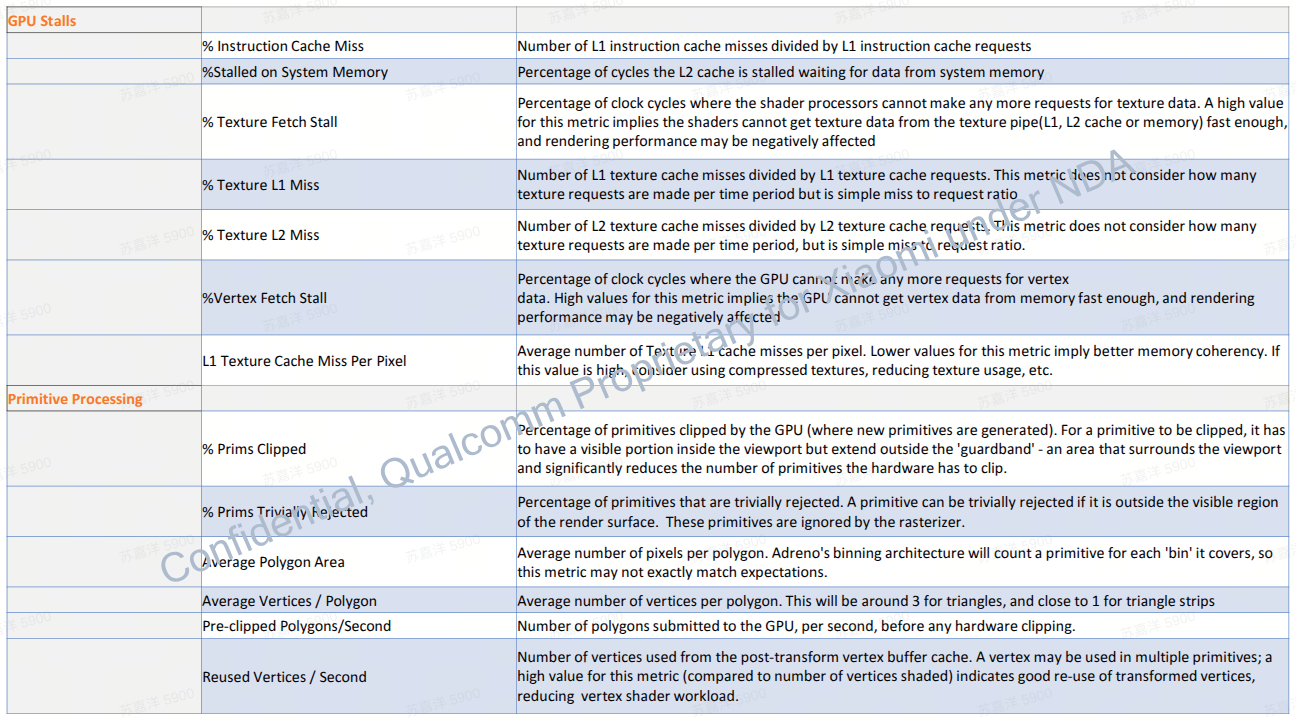
      counter_ids: 1  # Clocks / Second
      counter_ids: 3  # GPU % Utilization
      counter_ids: 21  # % Shaders Busy
      counter_ids: 26  # Fragment ALU Instructions / Sec (Full)
      counter_ids: 29  # Fragment EFU Instructions / Second
      counter_ids: 30  # Textures / Vertex
      counter_ids: 31  # Textures / Fragment
      counter_ids: 37  # % Time Shading Fragments
      counter_ids: 38  # % Time Shading Vertices
      counter_ids: 39  # % Time Compute
      counter_ids: 104  # GPU % Bus Busy
      counter_ids: 106  # % Vertex Fetch Stall
      counter_ids: 107  # % Texture Fetch Stall
      counter_ids: 108  # L1 Texture Cache Miss Per Pixel
      counter_ids: 109  # % Texture L1 Miss
      counter_ids: 110  # % Texture L2 Miss
      counter_ids: 111  # % Stalled on System Memory
      counter_ids: 112  # % Instruction Cache Miss
      counter_ids: 116  # % Shaders Stalled
      counter_ids: 117  # Vertices Shaded / Second
      counter_ids: 118  # Fragments Shaded / Second
      counter_ids: 119  # Vertex Instructions / Second
      counter_ids: 120  # Fragment Instructions / Second
      counter_ids: 122  # Fragment ALU Instructions / Sec (Half)
      counter_ids: 126  # ALU / Vertex
      counter_ids: 127  # ALU / Fragment
      counter_ids: 128  # EFU / Fragment
      counter_ids: 129  # EFU / Vertex
      counter_ids: 133  # % Shader ALU Capacity Utilized
      counter_ids: 134  # % Time ALUs Working
      counter_ids: 135  # % Time EFUs Working
      counter_ids: 136  # % Nearest Filtered
      counter_ids: 137  # % Linear Filtered
      counter_ids: 138  # % Anisotropic Filtered
      counter_ids: 139  # 暂未知
      counter_ids: 140  # % Texture Pipes Busy
      counter_ids: 142  # Read Total (Bytes/sec)
      counter_ids: 143  # Write Total (Bytes/sec)
      counter_ids: 144  # Texture Memory Read BW (Bytes/Second)
      counter_ids: 145  # Vertex Memory Read (Bytes/Second)
      counter_ids: 146  # SP Memory Read (Bytes/Second)
      counter_ids: 147  # Avg Bytes / Fragment
      counter_ids: 148  # Avg Bytes / Vertex
      counter_ids: 150  # Preemptions / second
      counter_ids: 151  # Avg Preemption Delay
      counter_ids: 152  # GPU Frequency
    }
  }
}- 想具备GPU Memory相关信息,添加
data_sources {
    config {
        name: "android.gpu.memory"
    }
}
提供一份完整的配置:
[附件: 自定义配置] + [附件: 官方提供的抓取工具 record_android_trace]
# 直接执行
chmod a+x record_perfetto
chmod a+x record_android_trace
./record_perfetto
抓atrace:正常抓即可
# 抓取开始:
adb shell atrace -a com.android.systemui,com.miui.home -c --async_start -z -b 20480 gfx input view wm am hal res power sched freq dalvik idle binder_lock binder_driver binder_driver ss aidl disk memreclaim
# 抓取结束:
adb shell atrace -b 20480 --async_stop > './s1.atrace'
1.3 工具解析kgsl events进行UI展示
[附件: GPU分析工具_1025.zip]
# 当前路径:/home/sujiayang/下载/GPU分析工具_1025/trace_detective_project

# 1、如果只有perfetto文件,需要先将perfetto转成atrace,记得加上后缀名比如.atrace,再解析
./traceconv systrace perfetto_path atrace_path

# 2、解析atrace文件,添加GPU展示信息
python test_analyze_once.py --output true --debug true -d trace_path
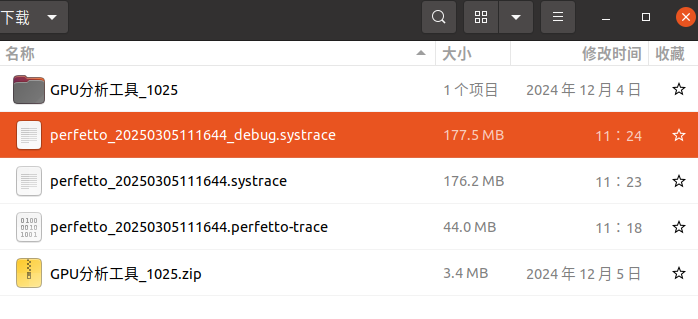
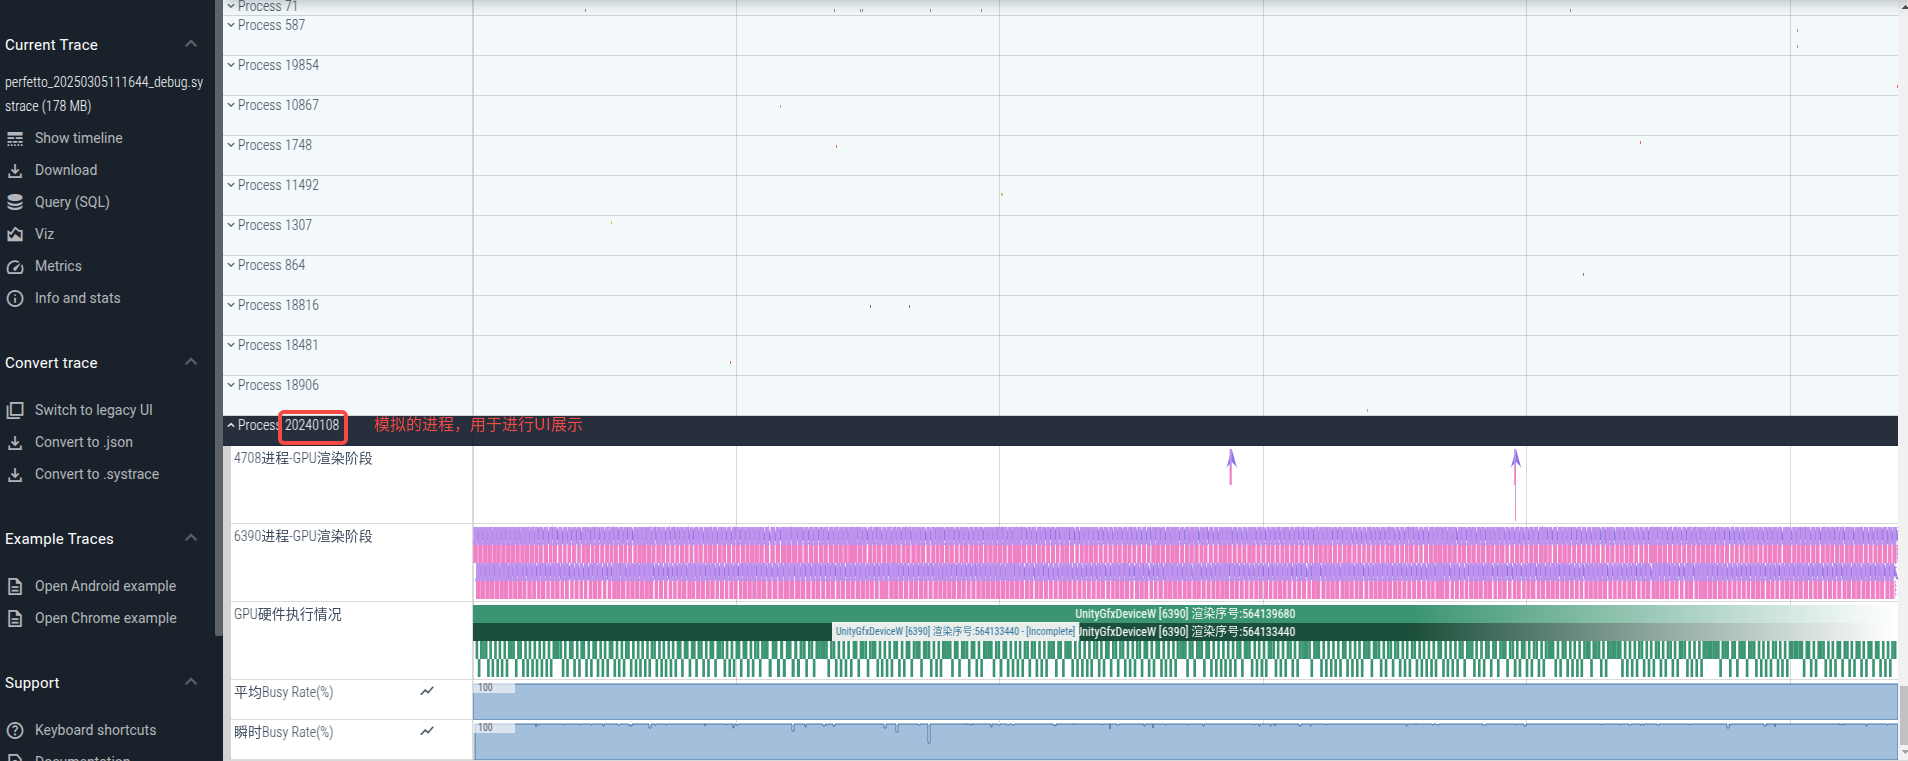
二、功能&用法
| 可以支持展示的GPU信息 | 高通 | MTK | F1 |
|---|---|---|---|
| 频率 | 有 | 有 | 有 |
| 优先级 | 有 | / | / |
| 渲染阶段 | 有 | / | / |
| 忙闲情况 | 有 | 有 | / |
| 实际GPU硬件执行耗时 | 有 | / | / |
| GPU Counters | 有 | / | / |
2.1 高通
参考资料:
- KBA-160606233316_REV_9_How_to_enable_kgsl_trace_to_debug.pdf 或 [附件: PDF]
- SDP for Xiaomi.pdf
- [附件: PDF]
- 80-64995-85_REV_AA_SM8750_SM8750P_Linux_Android_Graphics_Technical_Overview.pdf
- 80-NP885-1_REV_C_Graphics_Power_and_Performance_Overview.pdf
- 80-N9288-3_REV_F_Android_Graphics_Debug_Guide.pdf
- Qualcomm Linux Graphics Guide
- Game Developer Guides documentation
kgsl events分析
渲染阶段展示
# RenderThread提交渲染任务给GPU时,渲染任务要经历如下阶段:
# 其中我们最关心queued、submitted、retired
RenderThread-6823  ( 6642) [006] .... 260647.496460: adreno_cmdbatch_queued: id=7 timestamp=222 queued=1 flags=8 prio=8
RenderThread-6823  ( 6642) [006] .... 260647.496461: adreno_cmdbatch_ready: id=7 prio=8 timestamp=222 requeue_cnt=0
RenderThread-6823  ( 6642) [006] .... 260647.496477: adreno_cmdbatch_sync: id=7 timestamp=222 ticks=1752744 prio=8
RenderThread-6823  ( 6642) [006] .... 260647.496685: adreno_cmdbatch_submitted: id=7 timestamp=222 inflight=1 flags=8 ticks=1752744 secs=38815 usecs=339369 prio=8 rb_id=2 rptr=184 wptr=266 q_inflight=1 dispatch_queue=-1
kgsl_dispatcher-753   (  753) [005] .... 260647.497603: adreno_cmdbatch_retired: id=7 timestamp=222 inflight=1 recovery=0 flags=8 start=1756916 retire=1772228 prio=8 rb_id=2 rptr=266 wptr=266 q_inflight=1 fault_recovery=0 dispatch_queue=0 submitted_to_rb=0 retired_on_gmu=0
kgsl_dispatcher-753   (  753) [005] .... 260647.497606: adreno_cmdbatch_done: id=7 prio=8 timestamp=222
信息来源kgsl ftrace event:
- /sys/kernel/tracing/events/kgsl/adreno_cmdbatch_queued 在cmdbatch被发送到kgsl driver放入命令队列时触发,等待dispatcher提交到GPU Ringbuffer
- /sys/kernel/tracing/events/kgsl/adreno_cmdbatch_submitted 在cmdbatch被dispatcher提交到GPU Ringbuffer然后由GPU硬件执行时触发
- /sys/kernel/tracing/events/kgsl/adreno_cmdbatch_retired 在cmdbatch被GPU硬件执行完后从GPU Ringbuffer移除时触发
在Systrace上结合渲染阶段信息展示效果如下所示。

- 若从queued到submitted耗时长: It indicates a kgsl dispatcher SW issue, need to check from kgsl driver aspect.
- 若从submitted到retired耗时长: It indicates a GPU hardware issue, need to check GPU clock and busy state.
对于第1种情况,可以进一步检查是否是等sde fence引起的:结合HWC、GPU线程的耗时情况(还可进一步确认它们和kgsl_hwsched、kgsl-events、crtc_event、crtc_commit之间的唤醒关系)进行判断即可。
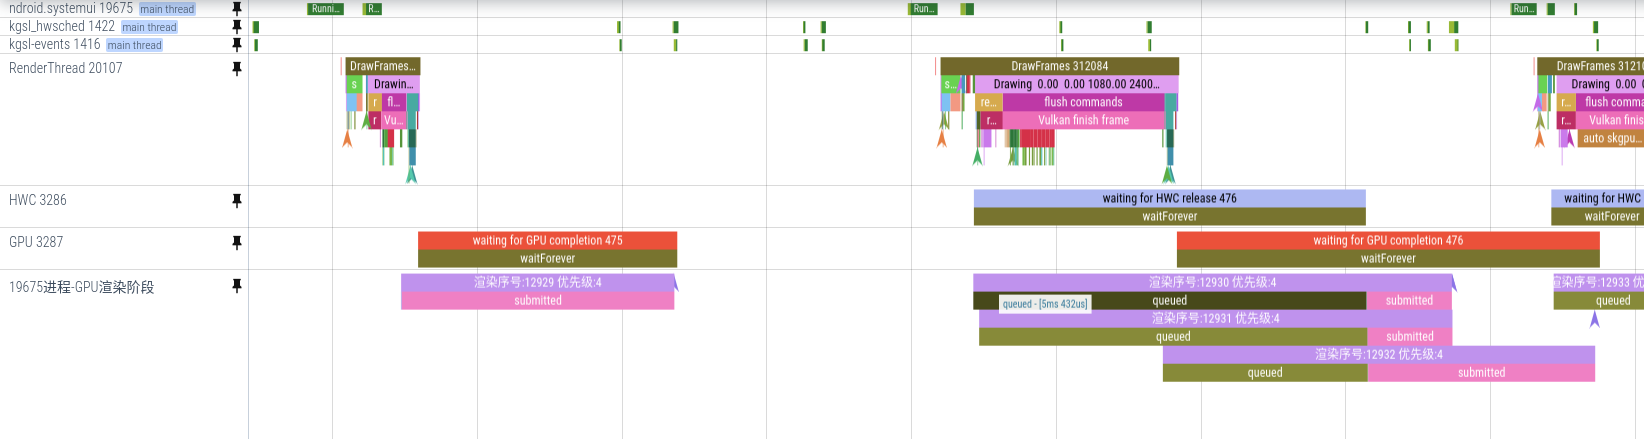
对于第2种情况,需要进一步确认GPU频率、Busy Rate、优先级抢占等信息。
检查GPU频率
kworker/u16:4-3052  ( 3052) [000] .... 1197825.381435: kgsl_pwrlevel: device_name=kgsl-3d0 pwrlevel=11 freq=220000000 prev_pwrlevel=10 prev_freq=285000000
kworker/u16:4-3052  ( 3052) [000] .... 1197825.381439: gpu_frequency: gpu_freq=220000 gpu_id=0
信息来源kgsl ftrace event:
- /sys/kernel/tracing/events/kgsl/kgsl_pwrlevel
- /sys/kernel/tracing/events/kgsl/gpu_frequency
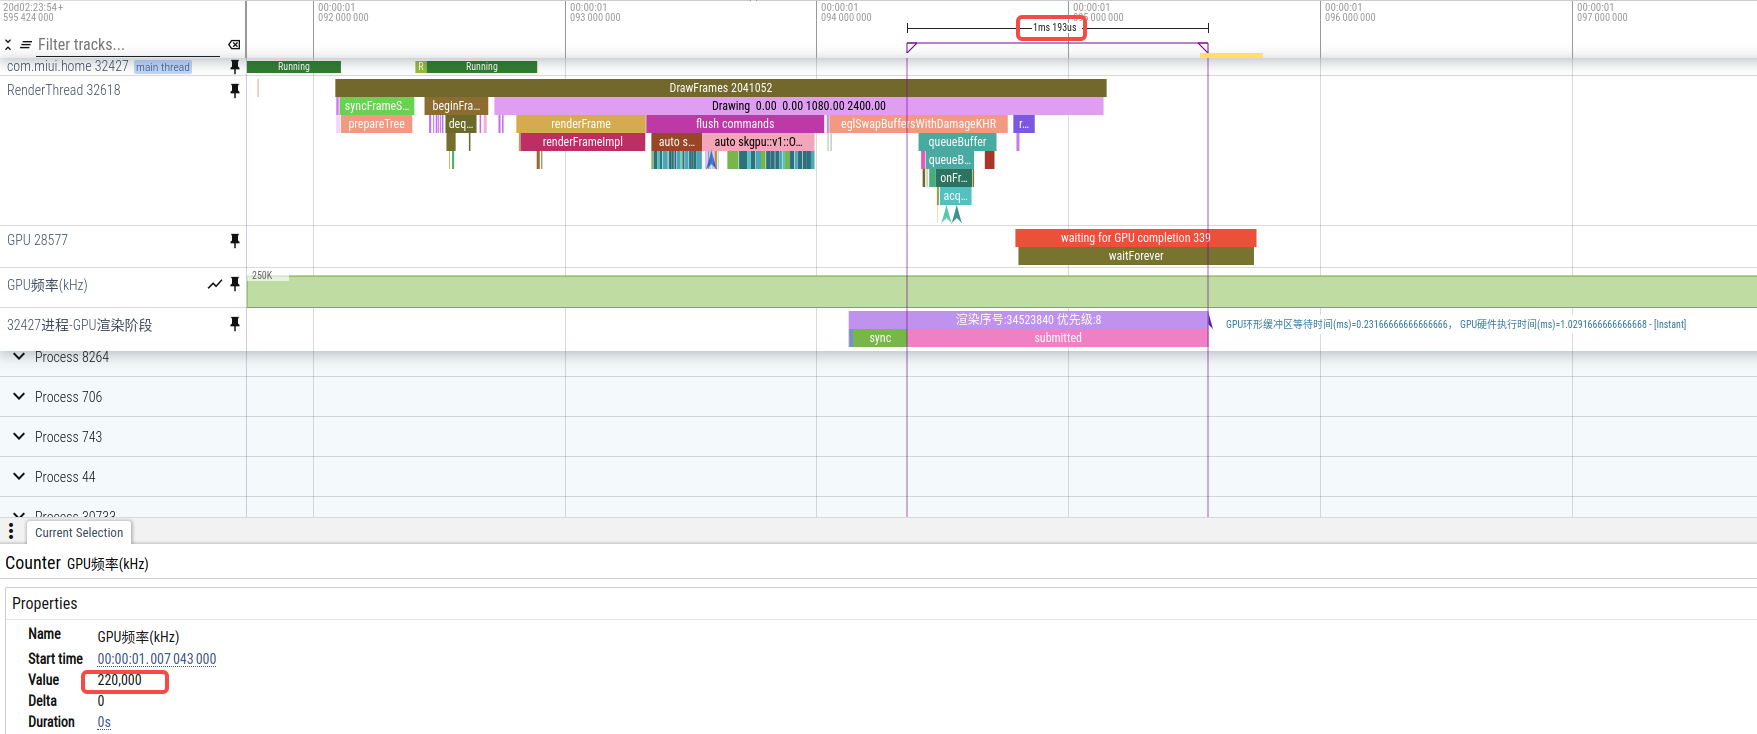
可进一步确认GPU硬件执行时间,判断提频是否真能解决问题。
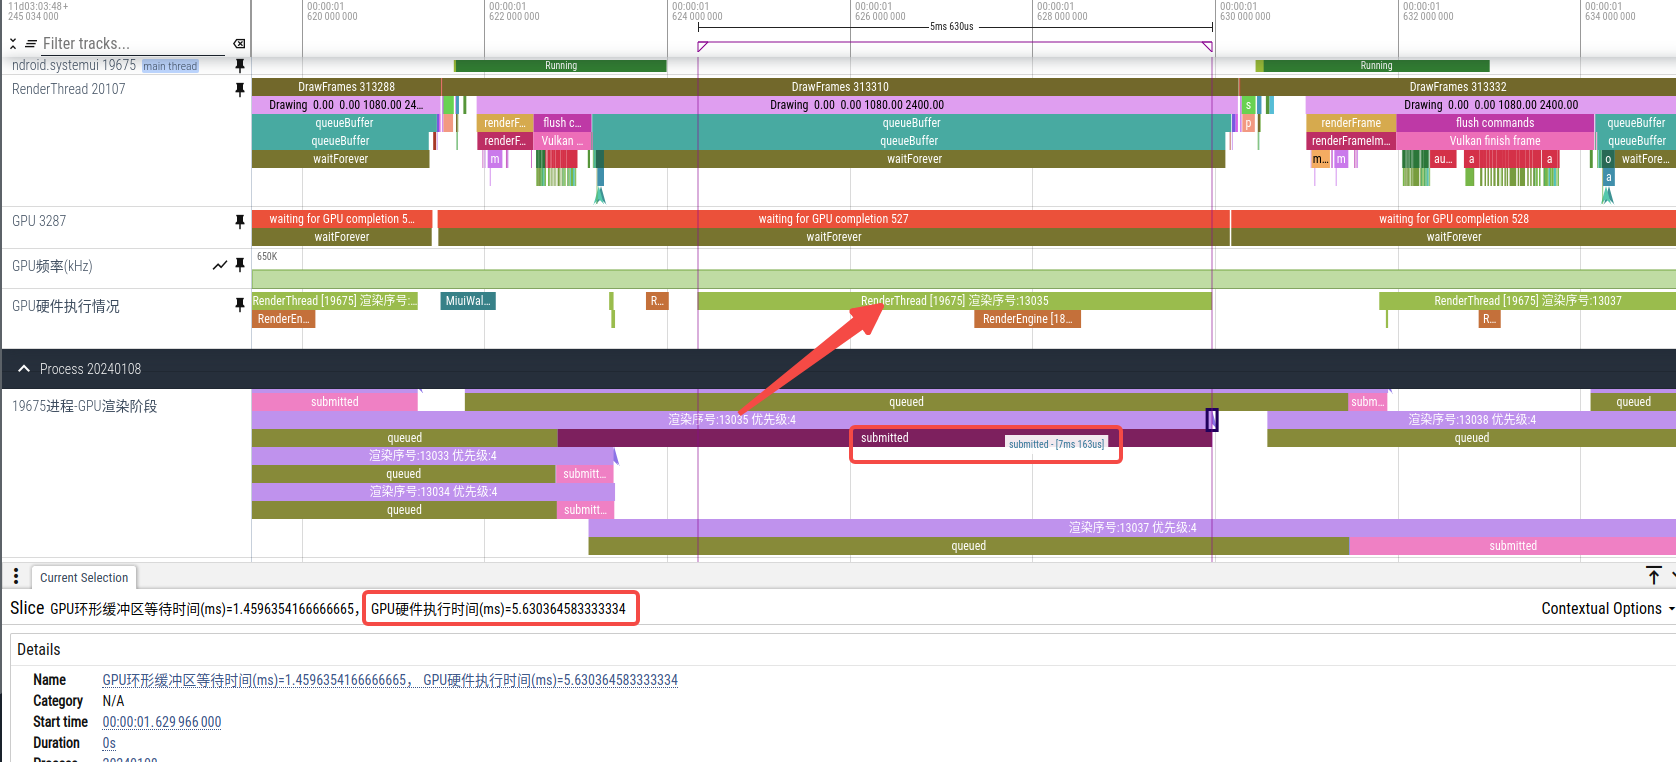
# 计算介绍如下:

# 1、原始日志
18067.375906: adreno_cmdbatch_queued: ctx=9 ctx_prio=4 ts=6239 queued=1 flags=CTX_SWITCH
18067.375915: adreno_cmdbatch_submitted: ctx=9 ctx_prio=4 ts=6239 inflight=1 flags=CTX_SWITCH ticks=195974551271 time=10120.913719 rb_id=1 r/w=0/0, q_inflight=0 dq_id=-1
18067.376667: adreno_cmdbatch_retired: ctx=9 ctx_prio=4 ts=6239 inflight=0 recovery=none flags=none start=195974558515 retire=195974564473 rb_id=1, r/w=0/0, q_inflight=0, dq_id=4294967295, submitted_to_rb=195974558296 retired_on_gmu=195974564835 active=5958

# 2、信息提取
queued_time = 18067.375906
submitted_time = 18067.375915
retired_time = 18067.376667
submit_ticks = 195974551271
start_ticks = 195974558515
retire_ticks = 195974564473

# 3、初步计算
total_time = retired_time - queued_time
    = 18067.376667 - 18067.375906 = 0.000761 = 0.761ms = 761us
cmdbatch_wait_time_on_context_queue = submitted_time - queued time
    = 18067.375915 - 18067.375906 = 0.000009 = 9us
cmdbatch_GPU_HW_execution_time = retired_time - submitted_time
    = 18067.376667 - 18067.375915 = 752us

# 4、二次计算
cmdbatch_GPU_HW_execution_time = GPU环形缓冲区等待时间(ms) + GPU硬件执行时间(ms)
gpu_alwayson_counter_freq = 19200000
GPU环形缓冲区等待时间(ms) = (start_ticks - submit_ticks) / gpu_alwayson_counter_freq * 1000
    = (195974558515 - 195974551271) / 19200000 * 1000 = 0.377291667
GPU硬件执行时间(ms) = (retire_ticks - start_ticks) / gpu_alwayson_counter_freq * 1000
    = (195974564473 - 195974558515) / 19200000 * 1000 = 0.3103125
查看Busy Rate
kworker/u16:0-32362 (32362) [005] .... 961429.979961: kgsl_pwrstats: device_name=kgsl-3d0 total_time=11245 busy_time=6234 ram_time=260892 ram_wait=29249 context_count=3
kworker/u16:0-32362 (32362) [005] .... 961429.993079: kgsl_gpubusy: device_name=kgsl-3d0 busy=458867 elapsed=1009661
信息来源kgsl ftrace event:
- /sys/kernel/tracing/events/kgsl/kgsl_pwrstats
- /sys/kernel/tracing/events/kgsl/kgsl_gpubusy
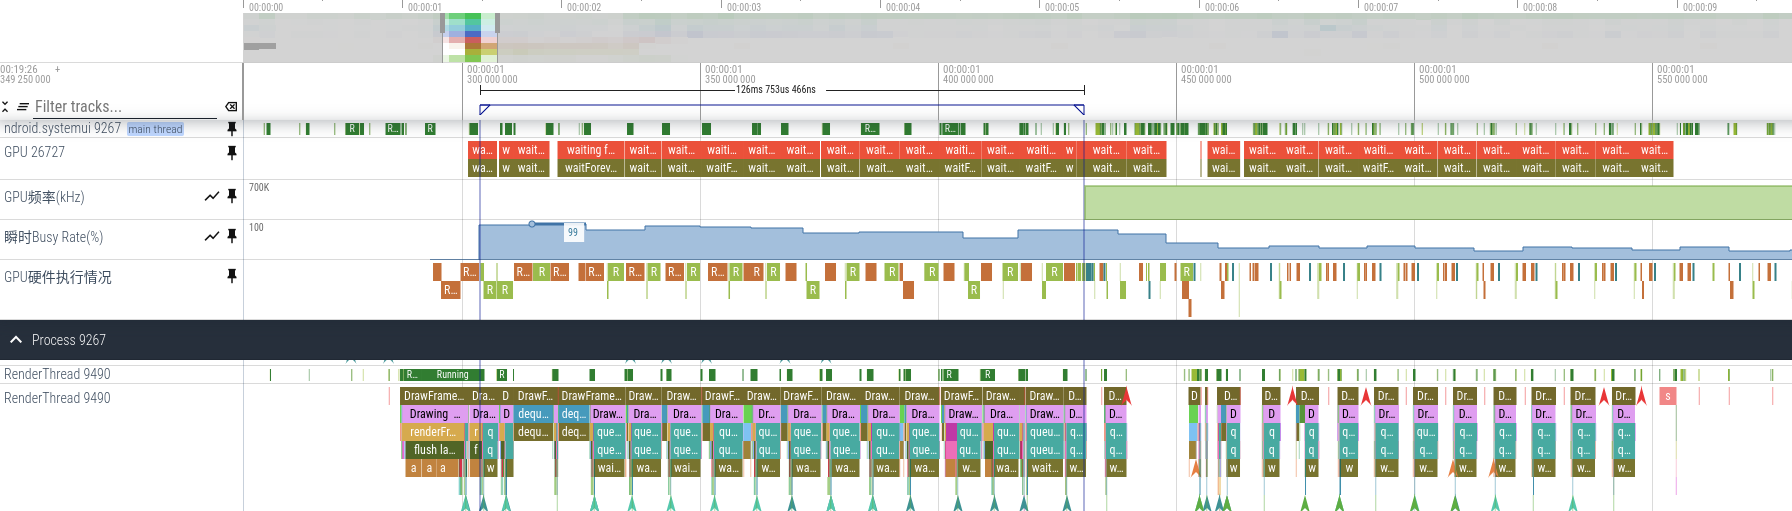
PERFLOCKSD-1942 ( 1727) [005] .... 1167.780117: kgsl_pwrlevel: device_name=kgsl-3d0 pwrlevel=5 freq=660000000 prev_pwrlevel=11 prev_freq=222000000锁屏解锁场景,可以看到长达一百多毫秒瞬时Busy Rate居高不下,GPU频率提高后才降下来。
检查优先级抢占
结合工具添加的GPU渲染阶段、GPU硬件执行情况信息,观察APP和SF渲染任务的重叠情况,可直观看到抢占。
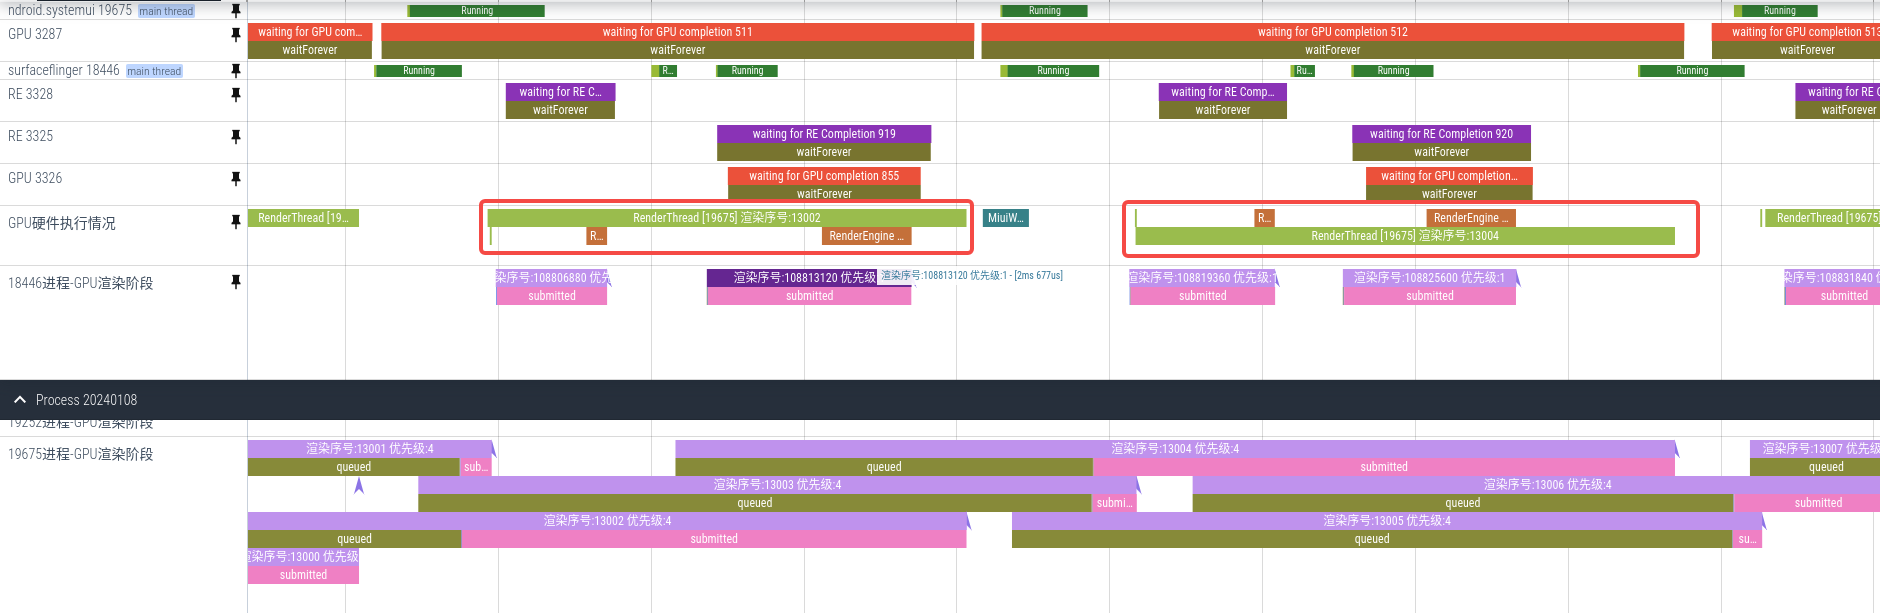
锁屏解锁场景,SystemUI优先级4低于SF优先级1会被抢占。
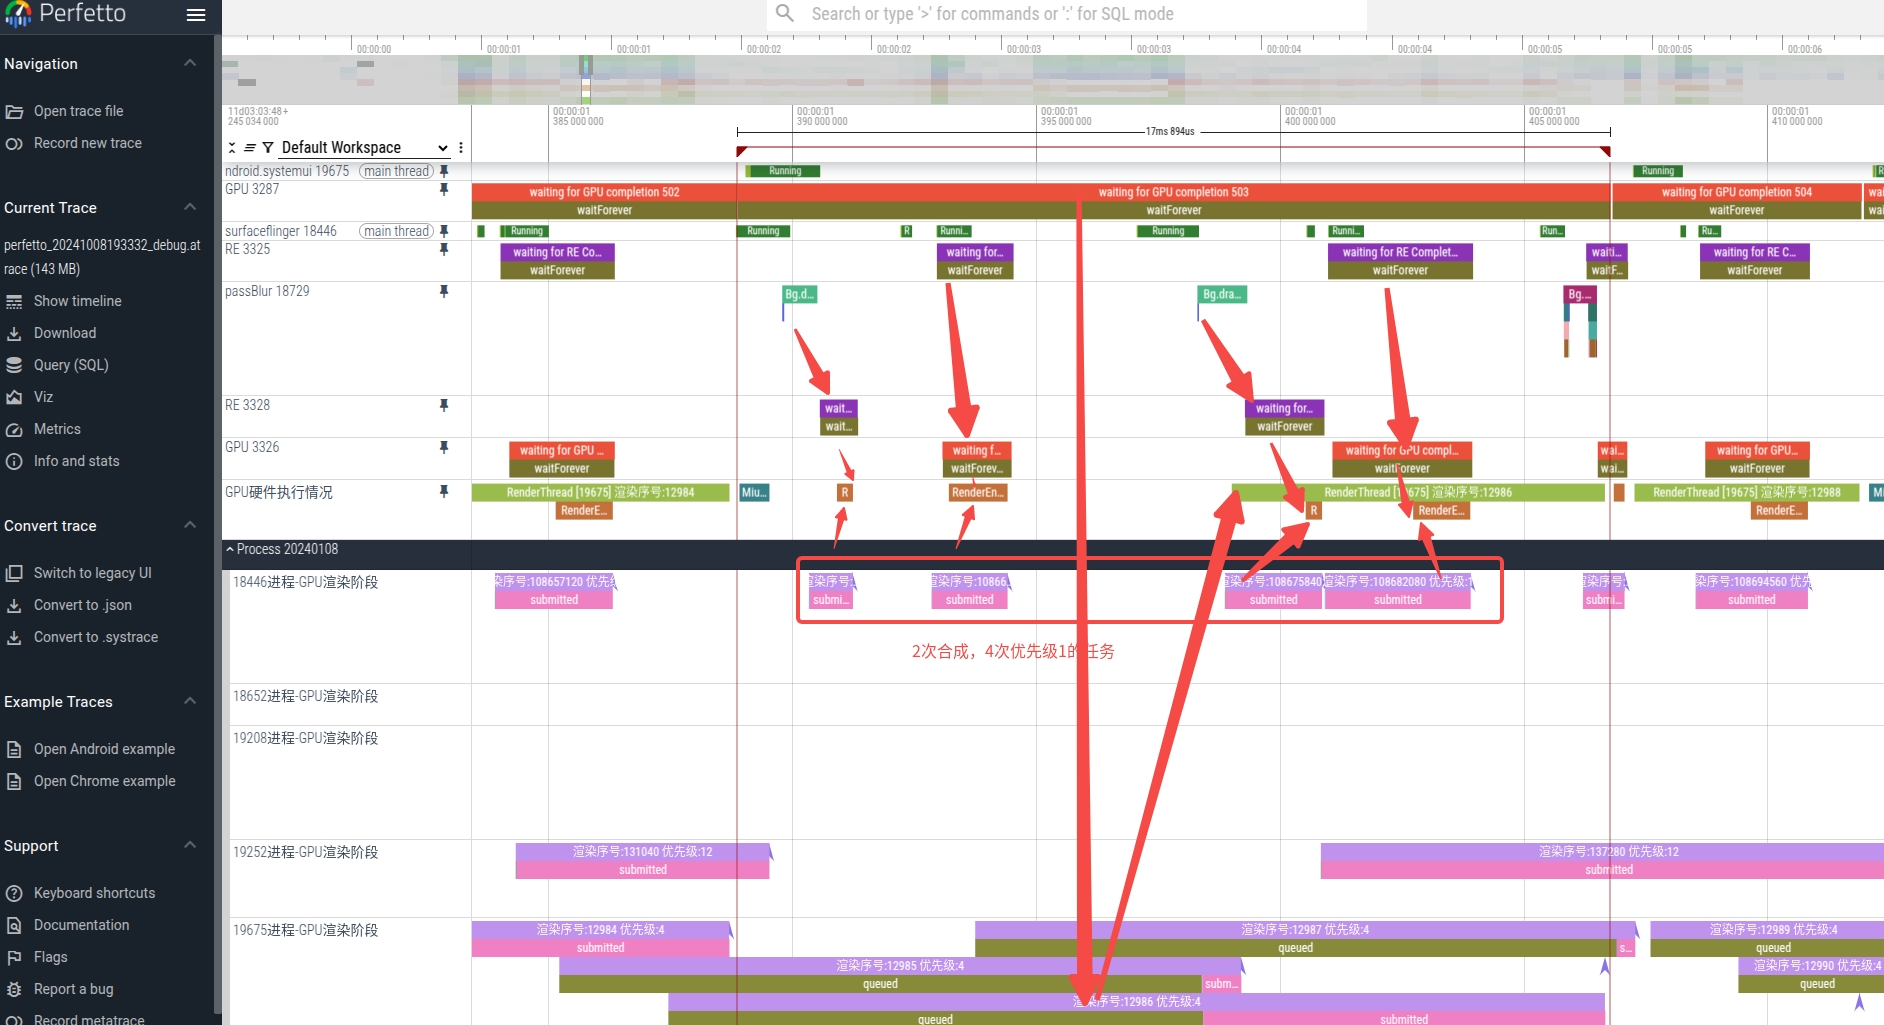
这张图能看到SystemUI的这次渲染序号:12986 优先级:4的渲染任务被SF抢占了4次才完成,此处SF的模糊混色功能生效参与绘制合成了,1次合成是有2次优先级1的GPU任务提交的。
gpu.counters && gpu.renderstages
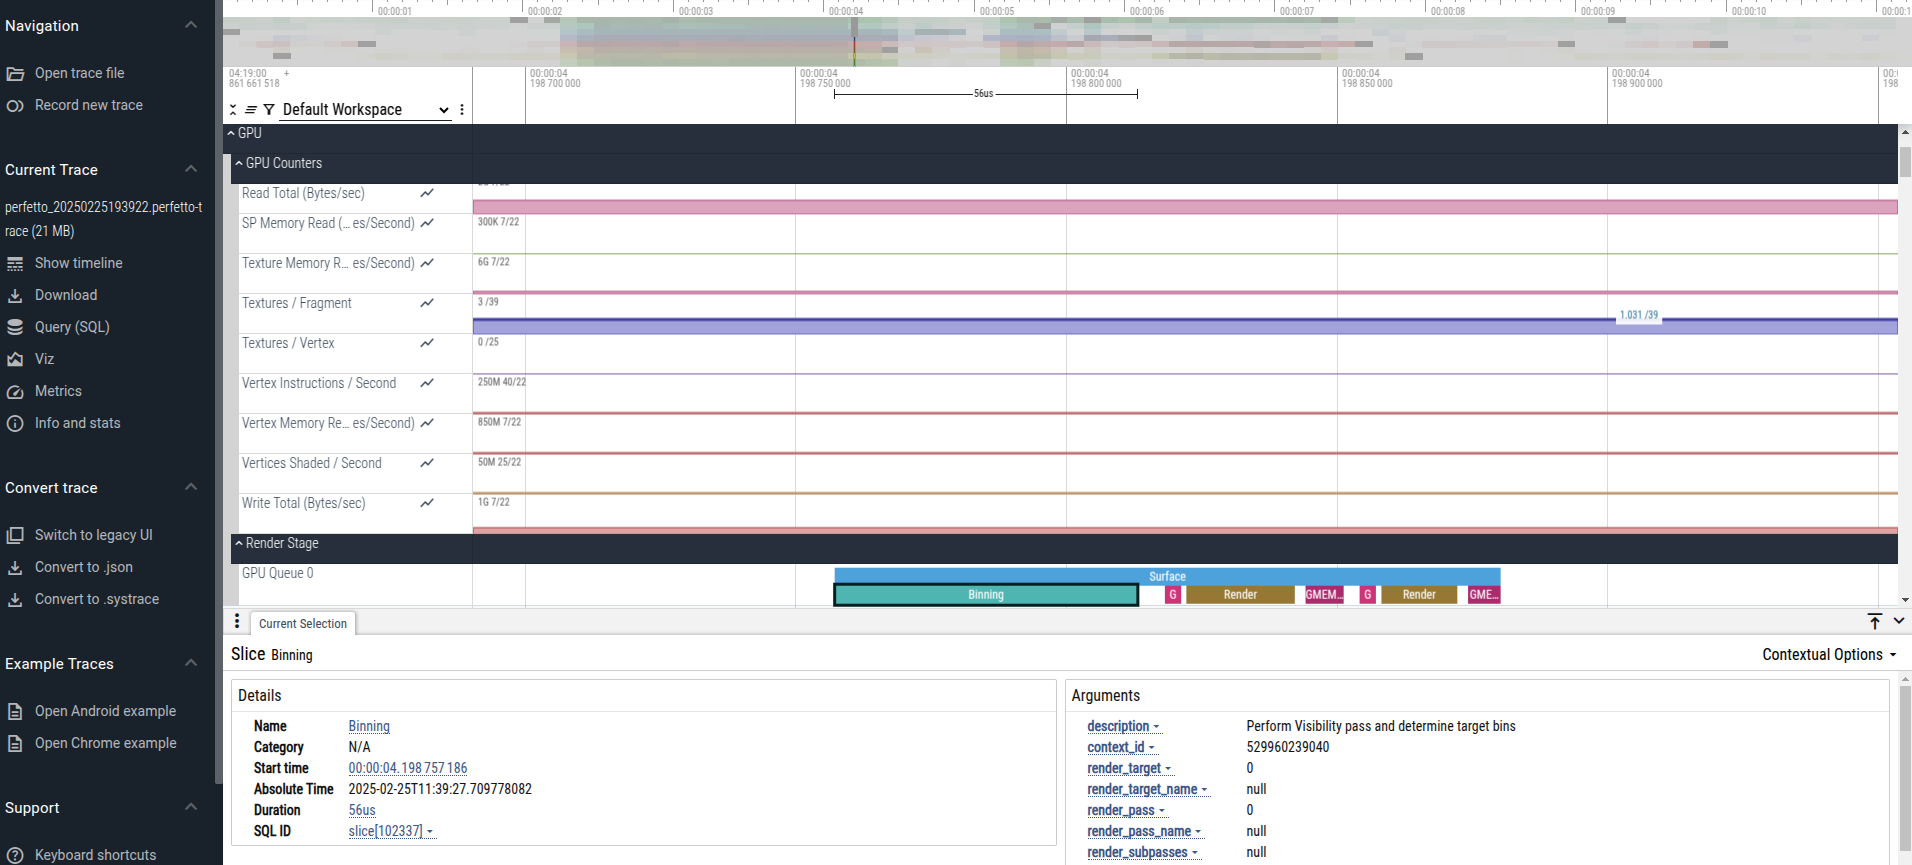
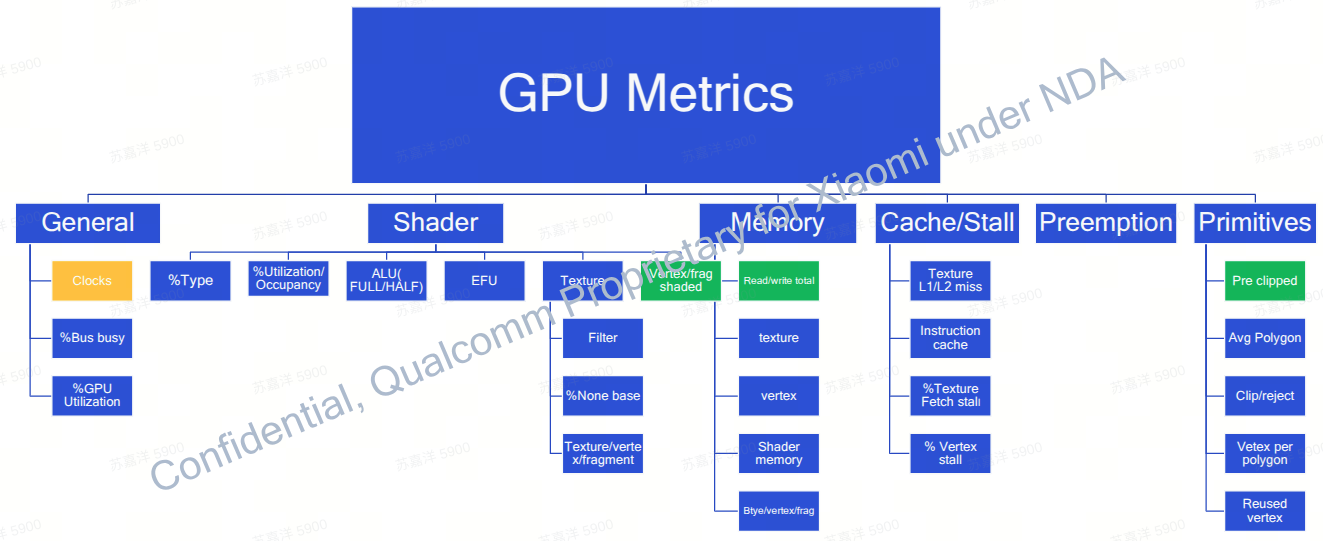
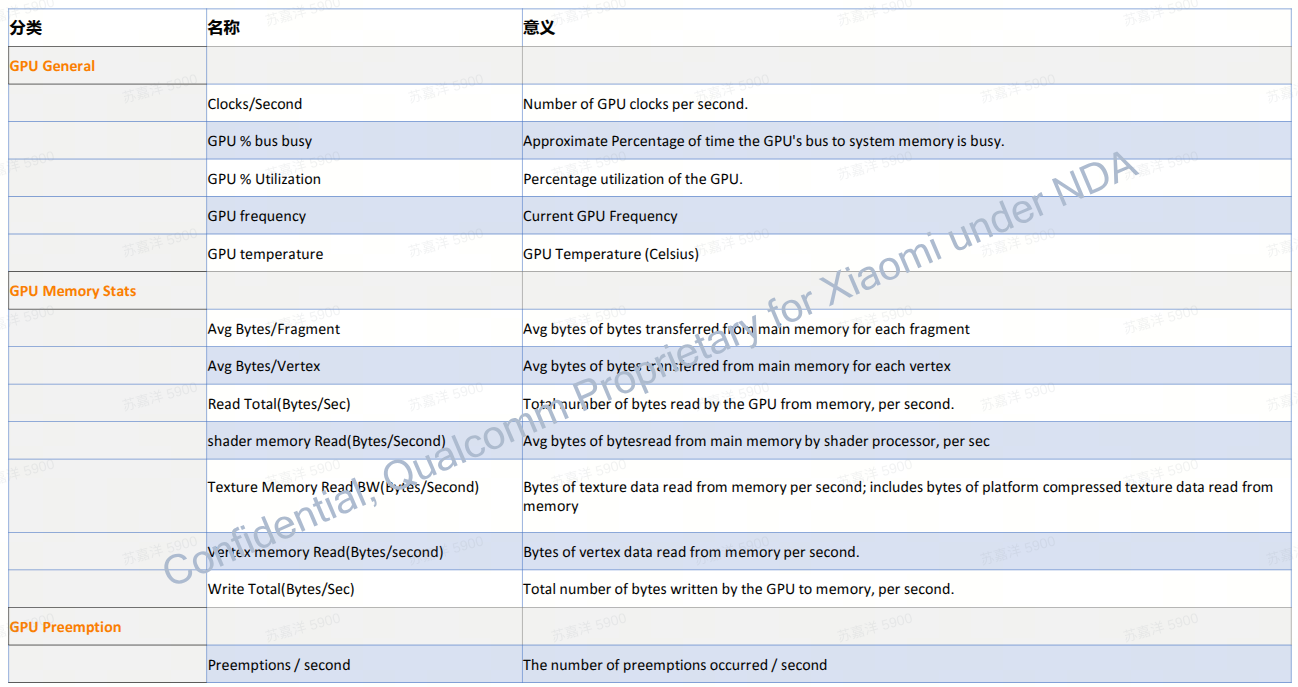
常见counters含义及数值合理区间参考:quick-start-with-performance-analysis
2.2 MTK
- /sys/module/ged/parameters/ged_log_perf_trace_enable
使能后抓取systrace,搜索5566进程,可以看到GPU的freq相关信息

暂无其它可用信息,待进一步调查。